Using memtrace on Windows
It is said that good things come to those who wait. Jacques-Henri Jourdan demonstrated Statistically profiling memory in OCaml at the 2016 OCaml Workshop and experimental branches of it existed for OCaml 4.03–4.07 in opam. Parts of the work were merged in OCaml 4.10 and the final sections landed with 4.11. The compiler provides support in the form of a series of hooks in various parts of the runtime’s allocation and garbage collection routines. A few weeks ago, Jane Street released memtrace and Memtrace viewer and earlier this week blogged about its use. I thought I’d quickly share the experience of using it on native Windows.
At present, although the memtrace library is portable, the memtrace-viewer itself is not (as it happens, this is simply down to Core’s command line parser pulling in a little too much Unix-specific stuff, and the use of Async as a backend to Cohttp, rather than Lwt, but that’s for another time!). However, WSL to the rescue…
I’ve set-up a demo repository which allows you to run the buggy version of js_of_ocaml from Luke’s blog post as a native Windows application which can emit a trace, then use memtrace-viewer from Ubuntu running in WSL in the same directory to serve the trace locally, which can then be browsed in Edge.
The repo assumes you’ve set-up any one of the four native Windows ports (yes, unlike Spacetime, this works with 32-bit too!) and have a working OCaml compiler in Path. The demo repository provides all of the dependencies as Git submodules: there’s a patch for Dune awaiting merge, a small patch for memtrace and some minor tweaks to the dependencies for memtrace_viewer which I’ll upstream in the next few days. Anyway:
git clone https://github.com/dra27/leaky.git --recurse-submodules
cd leaky
cd vendor\dune-repo
ocaml bootstrap.ml
cd ..\..
That gets us a working Dune. We need something to run our buggy js_of_ocaml over, so how about memtrace-viewer’s client library:
vendor\dune-repo\dune build vendor\memtrace_viewer_with_deps\client\main.bc
Now we’re ready to get a trace:
set MEMTRACE=leaky.ctf
vendor\dune-repo\dune exec -- js_of_ocaml.exe compile -o foo.js _build\default\vendor\memtrace_viewer_with_deps\client\main.bc
You’ll get various messages along the way, but you should now have a leaky.ctf file which can be fed to memtrace-viewer in WSL:
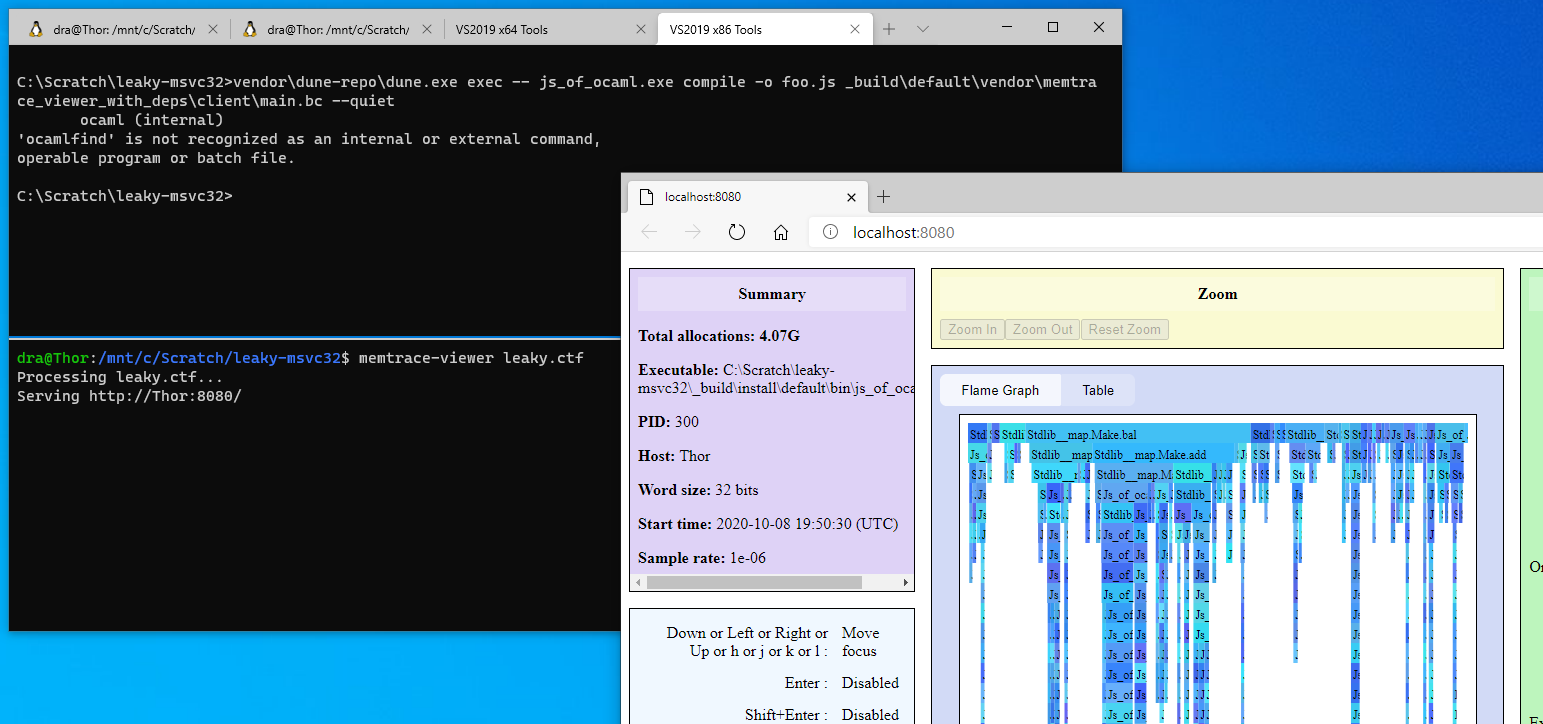
Obviously, at some point it’ll be nice not to have to rely on a Unix subsystem in order to run the viewer, but meanwhile it’s great to have a workflow on the same machine to be able to investigate memory leaks in native Windows programs!